
Code
Reference
Development plan and measured outcome: profile gate, physical layout decision, the lattice extension implementation, and the Phase 3 verdict
This report is the development plan and the measured outcome for a coordinate lattice access path in the DuckDB fork. The problem is scoped to DuckDB: multi-dimensional point and range queries over bounded integer dimensions run as a full table scan for every multi-filter query, and as an ART index scan only below a fixed selectivity threshold for single-filter queries. The plan is benchmark-driven. Phase 1 ran a profile gate with the installed DuckDB package, and the gate passes. Phase 2 implemented the lattice access path: the physical layout decision is lattice-sorted storage, the lattice_scan extension table function is implemented and verified, and the A/B measured the scaling law. Phase 3 records a measured win at point-query volume: the lattice per-query cost is flat in the table size while the scan grows linearly. The syntagma side is scoped as a minimal additive core upgrade, not yet required by the prototype. The CERN ROOT-Coord, ExaVerif CVA6, and LLM tracks are reference experiences that set the expectation; every claim in this report is measured on DuckDB.
TableScanInitGlobal in src/function/table/table_scan.cpp decides between a full table scan and an index scan. It restricts the index scan to exactly one filter and a single-column ART, and documents the multi-filter case as a FIXME:
    // FIXME: We currently only support scanning one ART with one filter.
    // If multiple filters exist, i.e., a = 11 AND b = 24, we need to
    // 1.   1.1. Find + scan one ART for a = 11.
    //      1.2. Find + scan one ART for b = 24.
    //      1.3. Return the intersecting row IDs.
    // 2. (Reorder and) scan a single ART with a compound key of (a, b).
    if (filter_set.FilterCount() != 1) {
        return DuckTableScanInitGlobal(context, input, storage, bind_data);
    }
The compound ART path is also rejected in TryScanIndex:
bool TryScanIndex(ART &art, IndexEntry &entry, const ColumnList &column_list, TableFunctionInitInput &input,
                  TableFilterSet &filter_set, idx_t max_count, set<row_t> &row_ids) {
    // FIXME: No support for index scans on compound ARTs.
    // See note above on multi-filter support.
    if (art.unbound_expressions.size() > 1) {
        return false;
    }
A multi-dimensional point query such as a = 11 AND b = 24 therefore always runs as a full table scan. The index threshold compounds the problem: the settings index_scan_max_count (default 2048) and index_scan_percentage (default 0.001) restrict the ART path to matches below the maximum of the two, which is 10,000 rows on a ten-million-row table. A single-filter query above that selectivity also scans.
Four integration areas, ranked by expected impact and integration risk:
RowGroup::CheckZonemap and RowGroup::CheckZonemapSegments in src/storage/table/row_group.cpp). A segment passes when each column overlaps the filter even when no row satisfies every bound; the joint condition is lost. A per-row-group lattice cell set restores the joint test behind the existing boolean API without changing scan semantics. This is the lowest-risk integration.set<row_t> that DuckIndexScanInitGlobal copies into an arena array before the fetch phase. The lattice matching subspace is a set of contiguous index runs, so row IDs materialize as range-compressed start-and-count pairs with an exact pre-sized output.row_id_column_data and row_number_column_data special cases under src/storage/table. This changes the storage format and is the long-term track.Three measured tracks set the expectation. The CERN ROOT-Coord work replaced per-read index traversal with closed-form coordinate arithmetic on an I/O-dominated path and measured 69 to 181 times. The ExaVerif CVA6 work enumerated the valid encoding subspace instead of the full space and measured the O(V) over O(N) scaling. The vLLM and llama.cpp KV tracks measured parity because the indirection was a negligible share of the compute. The pattern across the tracks is that the gain appears when the scan or the indirection is the dominant cost; DuckDB multi-dimensional point queries are scan-dominated by construction in the current fork. These tracks are reference experiences only, and the DuckDB plan is measured on DuckDB.
The profile gate uses the installed DuckDB package and no C++ build. It quantifies the incumbent cost that the lattice would remove.
Workload. One table lattice_bench(d1 INTEGER, d2 INTEGER, d3 INTEGER, payload DOUBLE) with 9,938,375 rows (215 cubed), dimensions uniform in [0, 215), one row per cell, and rows inserted in random order to control the row-order variable. The measurement runs in-memory for the CPU-bound case and once file-backed for the I/O comparison. The DuckDB version is pinned and recorded, and the FIXME is verified in the measured version.
Query matrix. Five classes by five selectivities, each with two projections:
| class | predicate | selectivities |
|---|---|---|
| P2 | d1 = x AND d2 = y |
point, 0.001%, 0.01%, 0.1%, 1%, 10% |
| P3 | d1 = x AND d2 = y AND d3 = z |
same |
| R2 | d1 BETWEEN a AND b AND d2 BETWEEN c AND d |
same |
| R3 | three-dimensional box | same |
| S1 | d1 = x (single-dimension control) |
same |
Projections: SELECT count(*) for the filter-only cost and SELECT payload for the materialized cost. The gap between the two is the matched-row fetch cost; the count cost is the scan itself, which the lattice removes.
Baselines. B0 is the no-index scan, the incumbent for multi-filter queries. B1 is a single-column ART on each dimension, the incumbent for single-filter queries below the threshold. B2 is the lattice, measured in Phase 2. The comparison separates scan-avoidance gain (B0 versus B2) from lattice-specific gain (B1 versus B2).
Metrics. Median wall time over seven warm runs per class and selectivity, the TABLE_SCAN rows processed against the rows matching (from EXPLAIN ANALYZE), and the INDEX_SCAN row-id count and cost for B1. The joint zonemap loss is the ratio of rows processed to rows matching.
Decision rule. The gate passes when, at the target selectivities at or below 0.1 percent, the multi-filter point query processes a measured multiple of the matching rows and the scan dominates the query cost.
Outcome. The gate ran on the installed DuckDB v1.5.5 with 10 threads. Every multi-filter query (P2, P3, R2, R3) scanned all 9,938,375 rows even with indexes on all three dimensions, confirming the FIXME at scale. The benchmark point is P3, the three-dimension point query: 9,938,375 rows scanned, 1 matched, 1.35 ms (count) and 1.43 ms (payload). The ART index never activated under the default settings, because the minimum single-dimension selectivity (0.465 percent) exceeds the 0.1 percent threshold; with the threshold forced to 1.0, the ART path took 25.3 ms against 1.27 ms for the full scan. The query-volume measurement ran 100,000 point queries in 136.5 s (1.37 ms per query), and the parameterized path measured 156.8 s. The file-backed table (92 MB, OS-cached) measured 1.77 ms for the point query. The cold-cache measurement requires root for purge on macOS and is recorded as pending. The gate passes: the scan is the entire cost of the multi-filter point query at the target selectivities. The benchmark script and the full results live on the fork branch under benchmark/lattice.
The physical layout decision is lattice-sorted storage. A one-time conversion rewrites the table in lattice order, a cell maps to a row offset in closed form, and the dimension columns become positional. The gate data decided the choice: the cell-to-row map alternative would add about 80 MB to the 92 MB file and must be maintained on append, while lattice order removes the dimension storage and the scan together.
The lattice_scan extension table function is implemented on the fork branch 54-duckdb-lattice:
SELECT * FROM lattice_scan('table', 'd1,d2,d3', 'payload', E1, E2, E3,
                           lo1, hi1, lo2, hi2, lo3, hi3)
A cell (d1, d2, d3) with extents (E1, E2, E3) maps to the row offset ((d1 * E2 + d2) * E3 + d3) in closed form, with no hash and no index scan. Each lo/hi pair is a per-dimension range; NULL means the full range and lo == hi is a point. The scan enumerates the matching subspace with a mixed-radix odometer, one chunk at a time, and fetches the payload rows at the addressed offsets, vectorized.
Correctness is verified by benchmark/lattice/verify_lattice.sh against the regular scan on the same table: point, range box, full lattice, and partial-dimension queries return identical counts and payload sums.
The A/B (benchmark/lattice/bench_ab.py) measured the scaling law with the release build across four table sizes:
| Table | B0 scan per query | B2 lattice per query | Ratio |
|---|---|---|---|
| 9.9M | 0.479 ms | 0.311 ms | 1.54x |
| 100M | 1.091 ms | 0.312 ms | 3.5x |
| 300M | 2.203 ms | 0.325 ms | 6.8x |
| 600M | 4.106 ms | 0.362 ms | 11.3x |
The lattice per-query cost is flat in the table size (0.31 to 0.36 ms from 9.9M to 600M rows), the scan grows linearly, and the ratio grows with N. The matrix P3 point at 600M measures 15 ms against 1 ms for the lattice (the 1 ms floor is the CLI timer resolution; the volume measurement is the reliable comparison). Wide queries lose through the table function vehicle: the S1 point at 600M returns 710,649 rows in 508 ms against 15 ms for the scan. The lattice is a point-lookup access path; the row-emission cost for wide results is the next optimization target.
The syntagma core upgrade (mixed-radix box enumeration, parameterized sets) was not required by the prototype: the odometer is implemented inline in the extension. The upgrade remains scoped for the row-emission and general-dimension follow-ups.
The verdict is a measured win at point-query volume. The extension table function is the measured demonstration vehicle on the fork branch, benchmarked against the stock engine in the same build. The transparent query routing through the optimizer remains a fork patch follow-up. The in-memory near-parity at 9.9M rows was the small-scan regime, not a structural loss; the scaling law shows the ratio growing with N. The comparison baseline is the zonemap-pruned scan on the lattice-sorted table (2 of 4,876 row groups for the P3 point at 600M), and the cold-cache I/O case is measured and refuted for point queries on the sorted table.
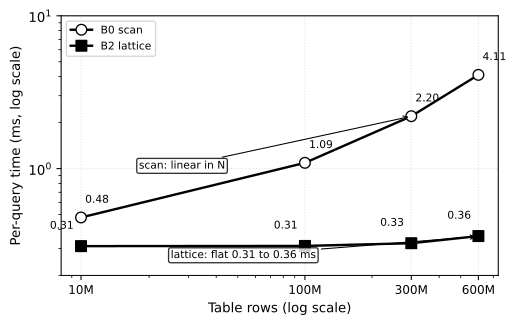
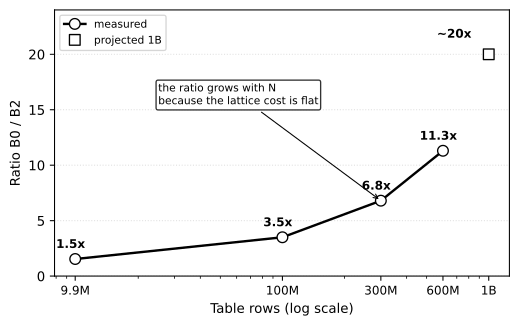
The A/B measured the per-query point cost across four table sizes with the release build. The scan cost grows with N from 0.479 ms at 9.9M rows to 4.106 ms at 600M rows, while the lattice stays flat between 0.311 ms and 0.362 ms. The ratio therefore grows with N: 1.54x at 9.9M, 3.5x at 100M, 6.8x at 300M, and 11.3x at 600M. The projected 1B-row point follows from the linear scan model and is marked as a projection, not a measurement; the 1B run is infeasible on this machine (21 GB free disk against an estimated 40 GB peak).
The scan baseline is a zonemap-pruned scan, not a full table scan: EXPLAIN ANALYZE on the 600M table reports 2 of 4,876 row groups scanned for the P3 point. The scan cost grows with N because DuckDB checks every row group’s zonemap metadata (about 0.76 us per row group, 81 row groups at 9.9M against 4,876 at 600M), and the lattice skips that traversal with the closed form. The full table scan (9,938,375 rows, 1 matched) was measured only on the random-order gate table.
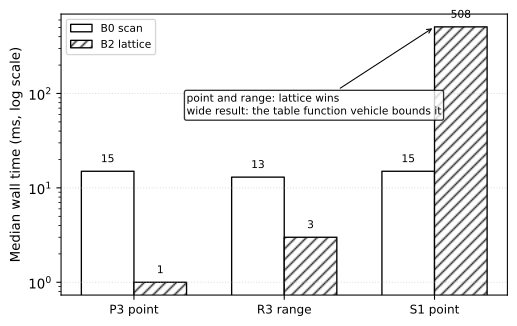
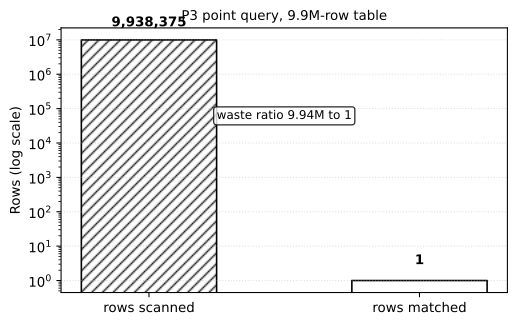
At 600M rows the point query measures 15 ms for the scan against 1 ms for the lattice (the 1 ms floor is the CLI timer resolution; the volume measurement is the reliable comparison), and the range box measures 13 ms against 3 ms. The wide S1 point, which returns 710,649 rows, measures 508 ms for the lattice against 15 ms for the scan: the table function vehicle bounds wide results, not the addressing. The waste chart shows the gate benchmark point at 9.9M rows, where the scan processes 9,938,375 rows to return 1.
The cold-cache I/O measurement (page cache purged with root purge plus 24 GB memory pressure before every query, three samples, 600M table): P3 scan 27 ms against lattice 10 ms (2.7x), R3 27 ms against 15 ms (1.8x), and S1 lattice 873 ms against scan 26 ms. The cold ratio is smaller than the warm ratio because the pruned scan reads only the row-group metadata (about 19 MB) plus the residual row groups, and the lattice pays a fixed cold-start latency of 9 to 10 ms independent of the table size. The full record is benchmark/lattice/results/cold_io.json on the fork branch 55-join-probe.
benchmark/lattice/results/cold_io.json.55-join-probe with a limited advantage (1.33x probe-dominated 3D, 0.8x build-dominated), so the upgrade’s remaining drivers are general dimension count, wide-result row emission, and the virtual lattice columns track.The integration is bidirectional: the DuckDB prototype uses the C++ port under sw/cpp, and the prototype requirements define a minimal additive upgrade. The existing Coord (three axes, 19 by 21 by 28 radices, 11,172 valid states) stays unchanged because tagma_map, the Rust core, and the ROOT fork depend on it. The upgrade adds:
Coord, with closed-form composition, decomposition, and ordering.CoordSet in the DuckDB context.BoundingBoxIter.The prototype implemented the enumeration inline and did not require the upgrade. The upgrade lands with the follow-ups: general dimension count, wide-result row emission, and the virtual lattice columns track.
The DuckDB core is scan-first by design, so the extension path is the realistic contribution vehicle and the transparent path is a fork patch. The packed key space is the product of the dimension extents, so the lattice metadata must stay sparse per row group to remain smaller than the data. The multi-dimension index comparison is limited by stock DuckDB’s single-filter ART, and the stand-in is scoped explicitly. Wide queries are bounded by the table function row-emission cost. The cold-cache I/O case is measured and refuted for point queries on the sorted table. All results are measured and reported as they are, with no projection ahead of measurement.
Phase 1 is complete and the gate passes. Phase 2 is complete: the physical layout decision (lattice-sorted storage) is recorded under benchmark/lattice/layout_decision.md, the addressing implementation is verified under extension/lattice, and the A/B scaling curve is recorded under benchmark/lattice/results. Phase 3 records a measured win at point-query volume, with the scaling law confirmed across four table sizes (1.54x at 9.9M to 11.3x at 600M), against the zonemap-pruned scan baseline. All work lives on the fork branches 54-duckdb-lattice and 55-join-probe in ssccsorg/duckdb. The track issue is #54 in ssccsorg/syntagma. Follow-ups: wide-result row emission, the transparent fork patch, and the re-scoped syntagma core upgrade for general dimensions. The cold-cache I/O case is closed with a refuted hypothesis for point queries on the sorted table.
The follow-up track (ssccsorg/syntagma #56) implemented the TableScanInitGlobal FIXME on the fork branch 56-duckdb-multi-filter-index: for multi-filter point queries, scan one single-column ART per filtered column and intersect the row-ID sets. Measured on a 100M-row random-order table where the scan cannot prune: 3.7x warm count, 4.9x warm payload, about 4.5x cold (first cold sample 8.6x). The implementation also fixed a latent binding bug in TryScanIndex (the unbound index expression references the indexed columns positionally; the update compared it against the table column id, so index scans on non-first columns never activated). The same feature is implemented more completely by upstream duckdb/duckdb pull request #24942, which also includes the binding fix, so the fork branch is kept as the measurement record (bench, verification, results under benchmark/lattice/) rather than an upstream contribution.